How to Gather Information Using Developer Tools
Overview:
This article will explain the Network Tab of Google Chrome’s developer tools window. Developer tools have similar functionality between all modern browsers. Request data, errors, and warnings can hold valuable diagnostic information to aid support cases.
Notes:
- Developer Tools can be opened with F12 in all major browsers or through settings.
Network Tab:

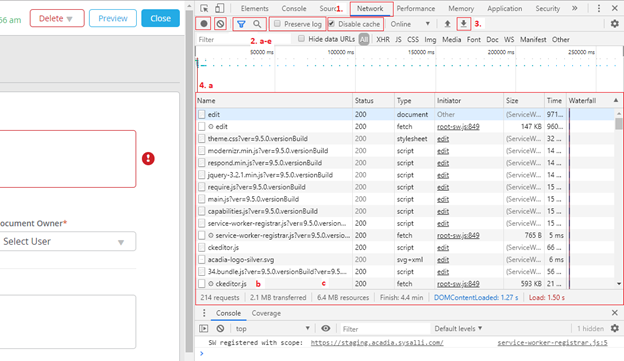
- Network Tab: This screenshot is from Google Chrome's Developer Tools. All browsers will have similar tabs and functionality. The center panel (4. a-c) is known as the Network Log.
- Useful tools for narrowing and interpreting data
- Record button: When lit up red, network requests are recorded. It can be turned off to keep 'timeout' requests from cluttering the results.
- Clear Results: Clears the current Network Log. Refreshing the page will repopulate results as long as record is turned on.
- Filter and Search: Filter displays network requests that match the entered criteria or selected file type (Name column of Network Log). Search looks for matches in the responses to network requests.
- Preserve Log: Preserves the Network Log through page refresh actions.
- Disable Cache: Disables the website's use of cached data while Developer Tools is open. Handy alternative to clearing cache manually or multiple times while testing an issue.
- Export HAR... : Exports all content from the Network Log to a .har file for easy sharing.
- Network Log: Displays information regarding all recorded network requests
- Selecting individual requests will display detailed information about the request and response.
- Data Transferred: The amount of compressed data that was sent over the network
- Data Resources: The full size of uncompressed data after it was downloaded.
Console Tab:

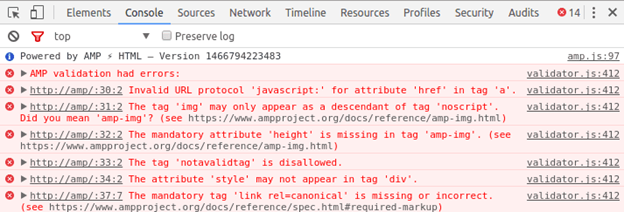
There are two types of output on the Console tab: Warnings and Errors
- Warnings are generally ok and do not cause issues with the web page.
- Errors usually mean something is going wrong with the code that the web page or app is running. The attached screenshot is an example of errors in the Google Chrome Developer Tools Console.
- Errors most likely mean there is an issue with Acadia.
- In SiteExecutive’s case, it is important to note whether errors appear while using the authoring site or the rendering site.
Further Reading: